
 blog
How to Estimate Competitor Ad Spend With Real Data
Last Updated: October 26, 2026
Quick Summary
To estimate competitor ad spend, multiply estimated monthly clicks by estimated cost per click, building clicks from search volume, paid click-through rate and the competitor's impression share. Present the result as a low-to-high range, because no outside method reveals a rival's actual budget.
- Meta's Ad Library and Google's Ads Transparency Center show live competitor ads without any paid spy tool.
- Repeated creative across keywords usually signals a campaign the brand is scaling.
- CPC estimates from keyword tools are averages across all advertisers, not what your competitor pays.
- Search leaves a public auction trail while social leaves only a creative trail with no bid data.
- Record creative volume and run dates weekly to see which competitors are scaling or pulling back.
Table of Contents
- Why Estimate Competitor Ad Spend (and What It Can't Tell You)
- How to Find Competitor Ads Across Search and Social
- Google Ads Competitor Analysis: Reading Auction and Keyword Signals
- Paid Search Budget Estimation: A Repeatable Formula With a Worked Example
- Competitor Ad Tracking Tools: What They Measure and Where They Guess
- Estimating Paid Social Spend and Separating Spend From Performance
- Putting Your Competitor Ad Spend Estimates to Work in NeuroAds Inc.
- Frequently Asked Questions
Why Estimate Competitor Ad Spend (and What It Can't Tell You)
Learning how to estimate competitor ad spend gives you a read on how crowded your auctions are, where rivals put their money, and which channels they treat as core.
Here is the hard truth: no outside method reveals a rival's actual budget.
So treat every number as a range, not a fact. Used that way, estimates still help you:
- Spot which channels a competitor favors
- Gauge auction pressure on your keywords
- Time your own pushes around their quiet periods
- Sanity-check your budget against the market
What they cannot tell you is their return, their margins, or whether their spend is working. Spend is an input. Performance is the output. Keep the two separate.
How to Find Competitor Ads Across Search and Social
Start with what competitors publish in public. Ad libraries and search results show live campaigns without any spy tool.
Locating Live Ads in Ad Libraries and Search Results
Meta's Ad Library and Google's Ads Transparency Center both let you search a brand and see active ads. Search the competitor's name on your core keywords and note which headlines repeat. Repeated creative usually signals a campaign the brand is scaling.
Reading Ad Creatives for Budget Signals
Volume tells a story. A brand running dozens of creative variants per week is funding testing at scale. A brand with two static ads is running lean. Watch for:
- How many variants run at once
- Whether video and static formats mix
- How often new creative appears
- Whether ads push discounts or full price
Frequent discounting often means the brand is buying volume, not building margin.
Google Ads Competitor Analysis: Reading Auction and Keyword Signals
Google Ads competitor analysis starts with the auction itself. Google's Ads Transparency Center shows which advertisers appear on a term, and third-party tools estimate keyword costs and traffic.
What you can do is build a picture from keyword research. Pull search volume and cost per click for the terms you share, then check which competitors appear.
Watch out: CPC estimates from keyword tools are averages across all advertisers.
Paid Search Budget Estimation: A Repeatable Formula With a Worked Example
Paid search budget estimation works best as a simple multiplication: estimated clicks times estimated cost per click. The output is a range, not a precise figure. Most guides stop at that sentence.
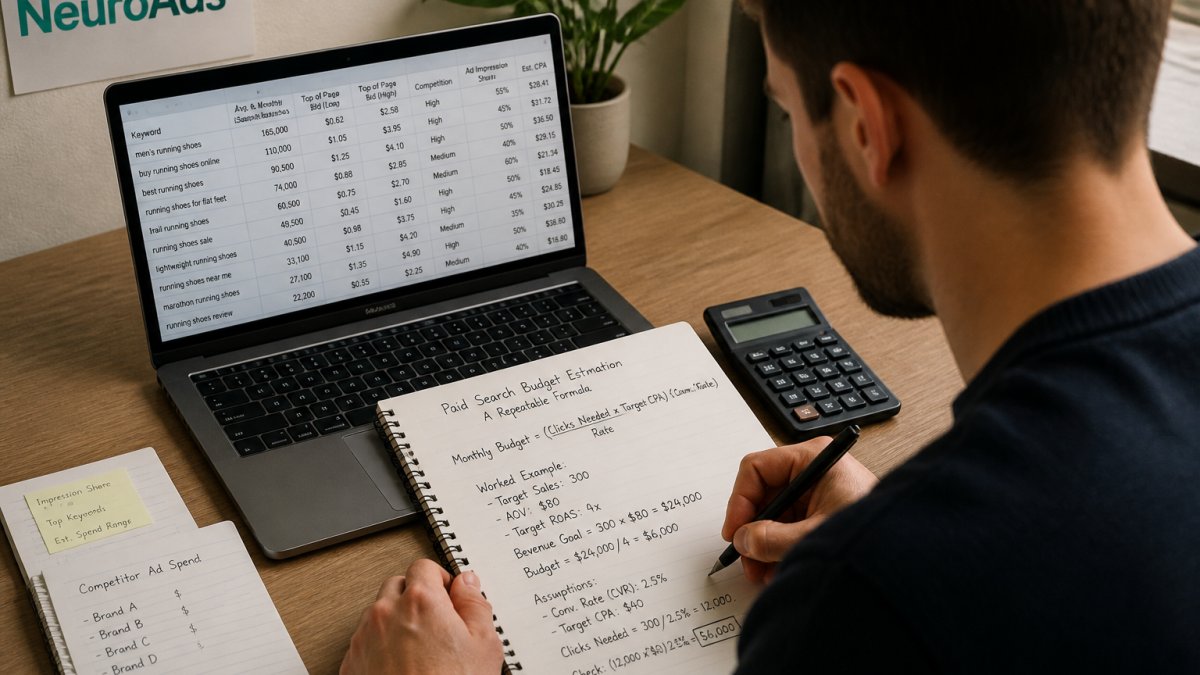
Here is the formula:
Estimated monthly spend = (estimated monthly clicks) × (estimated CPC)
And here is how each input is built:
Estimated monthly clicks = (monthly search volume) × (estimated click-through rate) × (competitor's estimated impression share)
That second formula is the part most articles skip. Search volume is not clicks.
AI Performance Marketing Platform →
A Worked Example With Real Arithmetic
Assume a competitor visibly bids on five keywords. For each, you pull monthly search volume from a keyword tool, assume a paid click-through rate in the range most practitioners observe for commercial terms, and estimate the competitor's impression share from how often their ad appears when you search the term yourself.
| Keyword | Monthly Volume | Assumed Paid CTR | Est. Impression Share | Est. Monthly Clicks | Est. CPC | Est. Monthly Spend |
|---|---|---|---|---|---|---|
| Term A | 2,000 | 4% | 50% | 40 | $2.50 | $100 |
| Term B | 5,000 | 4% | 40% | 80 | $3.00 | $240 |
| Term C | 1,200 | 3% | 60% | 22 | $1.80 | $40 |
| Term D | 8,000 | 3% | 30% | 72 | $2.20 | $158 |
| Term E | 3,500 | 4% | 45% | 63 | $2.75 | $173 |
| Total | 277 | $711 |
Read the table as a model, not a measurement. Every cell is an assumption you can challenge. If the competitor's impression share on Term B is actually 60% rather than 40%, the Term B estimate rises to roughly $360 and the total climbs past $800.
Building a Confidence Range Instead of a Single Number
A single figure invites false confidence. Build a low, middle, and high case instead, and change the assumptions that move the number most, click-through rate and impression share:
| Scenario | Click Share Assumption | CPC Assumption | Worked Total (five keywords) | What It Means |
|---|---|---|---|---|
| Low | Conservative share (half the middle case) | Below-average CPC | ~$450 | Floor estimate |
| Middle | Observed position | Category average CPC | ~$711 | Best guess |
| High | Aggressive share (1.5× the middle case) | Above-average CPC | ~$1,050 | Ceiling estimate |
Present the range, not the midpoint. It keeps your planning honest and gives you a defensible answer when someone asks how you arrived at the number.
Competitor Ad Tracking Tools: What They Measure and Where They Guess
Competitor ad tracking tools split into two groups. Some measure observed data: ad placements, creative changes, estimated traffic. Others guess at budgets using modeled data.
The measuring tools are reliable for what they see. The guessing tools are useful for direction only. What most reviews miss is that every budget figure from a third-party tool is a model, not a receipt.
Estimating Paid Social Spend and Separating Spend From Performance
Paid social spend is harder to estimate than search, and most guides wave at that difficulty without explaining why. The reason is structural: search leaves a public auction trail (who bids on what term), while social leaves a creative trail (what ads are running) with no public bid data attached. Ad libraries show creative volume, not budgets. Impression estimates and reach figures help, but they describe delivery, not dollars.
A Cross-Channel Framework: What You Can and Cannot Infer
The cleanest way to estimate across channels is to be explicit about the evidence each channel gives you. Use this table as your working framework:
| Channel | Public Evidence Available | What You Can Infer | What You Cannot Infer |
|---|---|---|---|
| Search | Ad presence on terms, keyword cost estimates, search volume | Rough click volume and spend range per keyword | Exact bids, quality score, actual CPC paid |
| Social | Ad library creative volume, run dates, formats, reach estimates | Relative activity level and testing intensity | Budget, targeting, actual delivery cost |
| Display | Ad placements observed, creative rotation | Presence and breadth of reach | Spend, frequency, viewability |
| Video | Ad library entries, creative length and variants | Production investment and testing cadence | Media budget, completion rates |
Read the table left to right: the more public evidence a channel exposes, the tighter your estimate can be. Search gives you the most to work with; video gives you the least budget signal but the clearest read on production investment.
What Social Evidence Actually Supports
For paid social, build the estimate from activity signals rather than pretending to know budgets:
- Creative volume per week. A brand shipping dozens of variants is funding testing at scale; a brand with two static ads is running lean.
- Format mix. Heavy video and carousel testing usually costs more to produce and often signals a larger media budget behind it.
- Run duration. Ads that stay live for weeks are usually backed by sustained spend; ads that vanish in days suggest small tests.
- Discount intensity. Frequent discounting often means the brand is buying volume, not building margin.
None of these gives you a dollar figure. Together they give you a relative ranking: which competitors are spending heavily on social, which are testing, and which are coasting. That ranking is often more useful for planning than a fake-precise budget number.
Separating Spend From Performance
This is where most teams blur two questions. How much is the competitor spending? And is it working? You can estimate the first. You cannot observe the second from outside.
To get closer to performance without inside data, watch for signals that spend alone cannot explain:
- Creative refresh rate. Rapid iteration suggests testing against a live result; static creative suggests a campaign on autopilot.
- Landing page changes. New offers and page tests usually follow a performance read, not a budget decision.
- Sustained vs. burst activity. A campaign that runs for months is more likely profitable than a two-week burst that disappears.
- Discount depth over time. Deepening discounts can signal margin pressure even while spend holds steady.
For a deeper look at telling spend apart from real performance signals, see Smarter Performance Signals vs ROAS: Unified Insights. That separation is the difference between copying a competitor's budget and copying their mistakes.
Putting Your Competitor Ad Spend Estimates to Work in NeuroAds Inc.
Estimates earn their keep when they change what you do next. Our AI-powered ad optimization and predictive targeting use data-driven performance signals. The integrated Shopify chatbot automates shopper recovery and objection handling. If you want the wider playbook, read our cross-channel ad optimization strategies, explore the AI Advertising Platform guide, or see what happens when you book a demo for AI ads.
Frequently Asked Questions
Can you see exactly how much a competitor spends on Google Ads?
No. Google does not publish advertiser budgets, and no tool has direct access to them. What you can see are signals: which keywords trigger a competitor's ads, how often those ads appear, and what the going cost per click is for those terms. Multiply estimated clicks by CPC and you get a spend estimate with a range, not a verified figure. Treat every number as a directional benchmark for market analysis, not a line item from their books.
How do you estimate a competitor's paid search budget from CPC and traffic?
Start with keyword research: list the terms a competitor bids on and pull search volume and cost per click estimates from a keyword planner. Estimate the share of clicks they capture using ad visibility and impression share signals, then multiply estimated clicks by CPC. For example, 2,000 monthly clicks at a $2.50 CPC suggests roughly $5,000 in monthly search spend. Apply a low and high CPC to build a confidence range, since auction competition moves bids up and down.
How often should I review competitor ad activity?
Monthly is enough for most DTC brands. Pull fresh keyword lists, check ad libraries for new creatives, and update your spend estimate so you can spot shifts in campaign strategy, such as a push into video advertising or a new audience. Review weekly during peak seasons or right after a competitor launches a promotion, because budget allocation can change fast. Keep each snapshot in a tracking template so you can benchmark changes over time rather than reacting to a single data point.
What is the difference between estimating competitor ad spend and measuring performance?
Spend is what a competitor puts in; performance is what they get out, and the two are not the same. A rival can outspend you and still lose on return on ad spend if their targeting or conversion rate is weak. Estimation methods only reveal budget scale and channel mix. To judge performance, watch for signals like how long a campaign runs, whether creatives get refreshed, and whether they expand into new channels, then focus your own budget optimization on the conversion path you control.
Most teams estimate competitor spend once, write it down, and never revisit it. The smarter move is to track the range monthly and let it steer your budget. Get started with NeuroAds Inc. and turn competitor estimates into sharper bidding, better targeting, and stronger ROAS.